


Python for Data Visualization: The Complete Masterclass

17 Students
 Last updated: June 28, 2024
 Language: English
 Flexible Schedule
Dive into the world of data visualization with “Python for Data Visualization: The Complete Masterclass.” This course is designed to transform how you perceive and present data. Whether you’re looking to create stunning line plots, dynamic histograms, or sophisticated scatter plots, this masterclass has got you covered. Using powerful tools like matplotlib, seaborn, Plotly, and Cufflinks, you’ll unlock the secrets to making your data not only comprehensible but also visually appealing. “Python for Data Visualization: The Complete Masterclass” ensures you gain a comprehensive understanding of how to visualize data in a way that makes a significant impact. By the end of this course, your ability to convey complex information through simple, beautiful visualizations will be second to none. Enrol now in “Python for Data Visualization: The Complete Masterclass” and elevate your data presentation skills to professional heights.
Learning Outcomes
- Master the setup and installation of data visualization tools.
- Create and customize line plots using matplotlib.
- Design and interpret histograms and bar charts.
- Develop complex visualizations with stack plots and stem plots.
- Visualize time series data effectively.
- Utilize seaborn and Plotly for advanced data visualization techniques.
Why buy this Python for Data Visualization: The Complete Masterclass course?
- Unlimited access to the course for forever
- Digital Certificate, Transcript, student ID all included in the price
- Absolutely no hidden fees
- Directly receive CPD accredited qualifications after course completion
- Receive one to one assistance on every weekday from professionals
- Immediately receive the PDF certificate after passing
- Receive the original copies of your certificate and transcript on the next working day
- Easily learn the skills and knowledge from the comfort of your home
Certification
After studying the course materials of the Python for Data Visualization: The Complete Masterclass there will be a written assignment test which you can take either during or at the end of the course. After successfully passing the test you will be able to claim the pdf certificate for £4.99. Original Hard Copy certificates need to be ordered at an additional cost of £8.
Who is this Python for Data Visualization: The Complete Masterclass course for?
- Data analysts looking to enhance their visualization skills.
- Python programmers wanting to specialize in data visualization.
- Students pursuing data science or related fields.
- Researchers needing to present data compellingly.
- Professionals aiming to improve their data presentation for reports.
- Enthusiasts eager to learn about data visualization tools and techniques.
Prerequisites
This Python for Data Visualization: The Complete Masterclass does not require you to have any prior qualifications or experience. You can just enrol and start learning. This Python for Data Visualization: The Complete Masterclass was made by professionals and it is compatible with all PC’s, Mac’s, tablets and smartphones. You will be able to access the course from anywhere at any time as long as you have a good enough internet connection.
Career path
- Data Analyst: £25,000 to £45,000 per year
- Data Scientist: £40,000 to £70,000 per year
- Business Intelligence Analyst: £30,000 to £55,000 per year
- Machine Learning Engineer: £45,000 to £75,000 per year
- Quantitative Analyst: £50,000 to £90,000 per year
- Data Visualization Specialist: £35,000 to £60,000 per year
Course Curriculum
| Setup & Installation | |||
| Installing the Anaconda Navigator | 00:07:00 | ||
| Installing Matplotlib, seaborn & cufflinks | 00:03:00 | ||
| Reading data from a csv file with pandas | 00:03:00 | ||
| Explaining Matplotlib libraries apart | 00:07:00 | ||
| Plotting Line Plots with matplotlib | |||
| Changing the axis scales | 00:06:00 | ||
| Label Styling | 00:04:00 | ||
| Adding a legend | 00:04:00 | ||
| Changing colors, linestyles, linewidth and markers | 00:09:00 | ||
| Adding a grid to the chart | 00:04:00 | ||
| Filling only a specific area | 00:07:00 | ||
| Filling area on line plots and filling only specific area | 00:04:00 | ||
| Changing fill color of different areas (negative vs positive for example) | 00:03:00 | ||
| Plotting Histograms & Bar Charts with matplotlib | |||
| Changing edge color and adding shadow on the edge | 00:04:00 | ||
| Adding legends, titles, location and rotating pie chart | 00:06:00 | ||
| Histograms vs Bar charts (Part 1) | 00:03:00 | ||
| Histograms vs Bar charts (Part 2) | 00:02:00 | ||
| Changing edge colour of the histogram | 00:03:00 | ||
| Changing the axis scale to log scale | 00:07:00 | ||
| Adding median to histogram | 00:04:00 | ||
| Advanced Histograms and Patches (Part 1) | 00:04:00 | ||
| Advanced Histograms and Patches (Part 2) | 00:05:00 | ||
| Overlaying bar plots on top of each other (Part 1) | 00:04:00 | ||
| Overlaying bar plots on top of each other (Part 2) | 00:01:00 | ||
| Creating Box and Whisker Plots | 00:11:00 | ||
| Plotting Stack Plots & Stem Plots | |||
| Plotting a basic stack plot | 00:13:00 | ||
| Plotting a stem plot | 00:05:00 | ||
| Plotting a stack plot od data with constant total | 00:04:00 | ||
| Plotting Scatter Plots with matplotlib | |||
| Plotting a basic scatter plot | 00:06:00 | ||
| Changing the size of the dots | 00:06:00 | ||
| Changing colors of markers | 00:05:00 | ||
| Adding edges to dots | 00:04:00 | ||
| Time Series Data Visualization with matplotlib | |||
| Using the Python datetime module | 00:03:00 | ||
| Connecting data points by line | 00:04:00 | ||
| Converting string dates using the .to_datetime() pandas method | 00:05:00 | ||
| Plotting live data using FuncAnimation in matplotlib | 00:04:00 | ||
| Creating multiple subplots | |||
| Setting up the number of rows and columns | 00:04:00 | ||
| Plotting multiple plots in one figure | 00:02:00 | ||
| Getting separate figures | 00:03:00 | ||
| Saving figures to your computer | 00:03:00 | ||
| Plotting charts using seaborn | |||
| Introduction to seaborn | 00:02:00 | ||
| Working on hue, style and size in seaborn | 00:05:00 | ||
| Subplots using seaborn | 00:05:00 | ||
| Line plots | 00:02:00 | ||
| Cat plots | 00:03:00 | ||
| Jointplot, pair plot and regression plot | 00:02:00 | ||
| Controlling Plotted Figure Aesthetics | 00:03:00 | ||
| Plotly and Cufflinks | |||
| Installation and Setup | 00:02:00 | ||
| Line, Scatter, Bar, box and area plot | 00:07:00 | ||
| 3D plots, spread plot and hist plot, bubble plot, and heatmap | 00:07:00 | ||
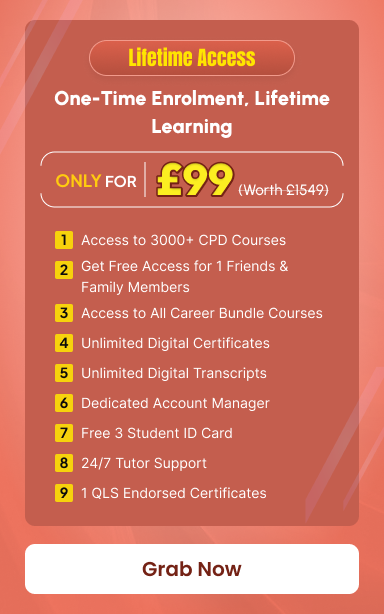



Exclusive Deal! 95% Off, Today Only!



This course includes:
-
 Skill Level
-
 Duration
3 hours, 44 minutes
Duration
3 hours, 44 minutes -
 Students
17 Students
Students
17 Students