

In this fast-paced and data driven world, effective decision making is crucial for success in any field. Data visualisation is the saviour of this modern world. It is a powerful tool that can turn huge amounts of difficult-to-understand and complex data into meaningful information. This information can be used for making better and quick decisions.
Want to know an interesting fact about data visualisation?
Even tho data visualisation is done digitally now, it is believed that Michael Florent Van Langren, a Dutch astronomer, first provided the visual representation of statistical data in 1644, long before digitalisation.
In this article, you will learn why data visualisation is your key to better decision making. You will also understand how it can streamline your processes, improve your understanding, and drive growth.

Understanding Data Visualisation
Before we can fully harness the potential of data visualisation, it’s crucial to understand what it is and why it’s so important. Let’s dive into learning about data visualisation.
What is Data Visualisation?
Data visualisation is the graphic representation of information and data. It converts raw data into charts, graphs, or maps to make the data easier to understand and reveal patterns, outliers, and trends. Some of the widely popular data visualisation tools are Tableau, Microsoft Power BI, and Google Data Studio. These tools offer users an extensive array of visual representation options, thereby helping people to understand data better and make better decisions.
Why is Data Visualisation Important?
This is the age of Big Data. Huge volumes of data are generated every minute. So it has become increasingly challenging to make sense of this data in its raw and numerical form. Data visualisation brings a solution by translating these complex data sets into simple visuals, making data understanding a breeze even for non-data experts. This leads to quicker data analysis, faster decision-making, and improved business outcomes.
The Role of Data Visualisation in Decision Making
So now we have a basic understanding of data visualisation, but how does it impact decision-making? Let’s learn about the important role of data visualisation in business decision-making processes.
Enhanced Data Understanding
Data visualisation allows anyone, irrespective of their technical prowess, to interpret complex data sets. It maps raw data into visual insights, which are easier for the human brain to process and understand. Thus, businesses can make well-informed decisions faster.
Spotting Trends and Patterns
One of the primary advantages of data visualisation is the ability to identify patterns and trends that would be challenging to spot in text-based data. For instance, line graphs can show sales trends over time, and heat maps can show areas with high customer activity. Recognising these patterns helps predict future trends, enabling proactive decision making.
Simplifying Complex Data Sets
With businesses dealing with massive and complex data sets daily, data visualisation offers the perfect solution. By turning complex data into clear, engaging visuals, it simplifies data interpretation and speeds up the decision-making process.

Different Types of Data Visualisation Tools
Data visualisation’s growing significance has led to a number of tools designed to visualise data effectively. Let’s touch upon a few leading ones, each with its unique strengths.
Tableau
Tableau is a powerful data visualisation tool known for its engaging interface and extensive capabilities. It can manage vast datasets and create interactive visualisations useful for both technical and non-technical users.
Microsoft Power BI
Power BI is a Microsoft product that integrates smoothly with its ecosystem. Its key strengths lie in its real-time analytics capabilities and a user-friendly interface with diverse visualisation options.
Google Data Studio
Google Data Studio is a free tool which harmonises well with Google services. It’s an excellent choice for teams looking for user-friendly, collaborative features and simple, effective data visualisations.
QlikView
QlikView stands out with its associative model, allowing users to create a broad spectrum of interactive data visualisations. It is highly scalable, making it suitable for enterprises handling large datasets.
Looker
Looker is a modern web-based platform renowned for its flexible data modelling language, LookML, and has strong data visualisation capabilities. It is ideal for businesses requiring extensive customisation in their data analysis.
Understanding these different data visualisation tools will help you select the one that best aligns with your business needs, thereby improving your data-driven decision making process.
Key Features of Data Visualisation Tools
You should now understand the importance, role and different data visualisation tools. it’s time to highlight some of the key features of these data visualisation tools. These features improve the utility and effectiveness of data visualisation, making it helpful in decision making.
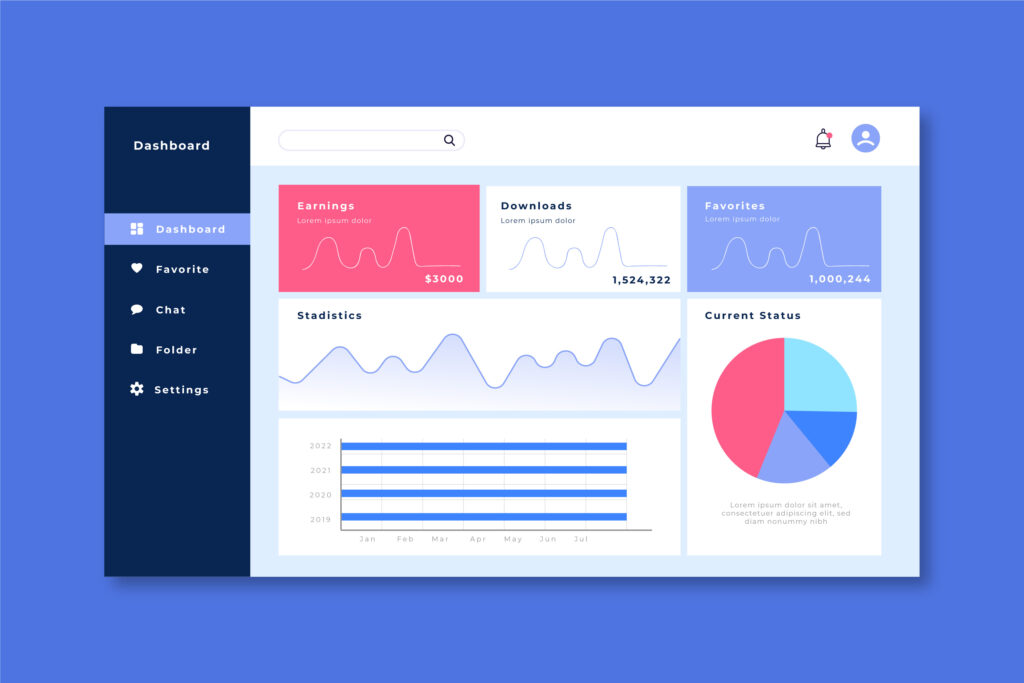
Interactive Dashboards
Most data visualisation tools offer interactive dashboards that allow users to manipulate data and visuals dynamically. These dashboards help drill down into specific metrics, enabling users to explore different perspectives and make well-informed decisions.
Real-Time Data Analysis
Real-time data analysis is a crucial feature of many data visualisation tools. It enables businesses to track their operations in real time, making it possible to respond quickly to any changes and make timely decisions.
Customisable Reports
These tools often provide customisable reporting features, allowing users to tailor visuals and reports based on their needs. This ensures that key stakeholders have access to relevant information in a format that best helps their decision-making.
How to Effectively Utilise Data Visualisation for Decision Making
To reap the full benefits of data visualisation, it’s important to know how to use it effectively. In this section, we’ll explore some strategies to harness the full power of data visualisation in your decision-making process.
Identify Your Goals
Before embarking on data visualisation, it’s crucial to identify what you want to achieve. Do you want to understand customer behaviour, track sales trends, or measure product performance? Clear objectives guide your data visualisation process and ensure the insights you gain align with your decision-making needs.
Select Appropriate Visuals
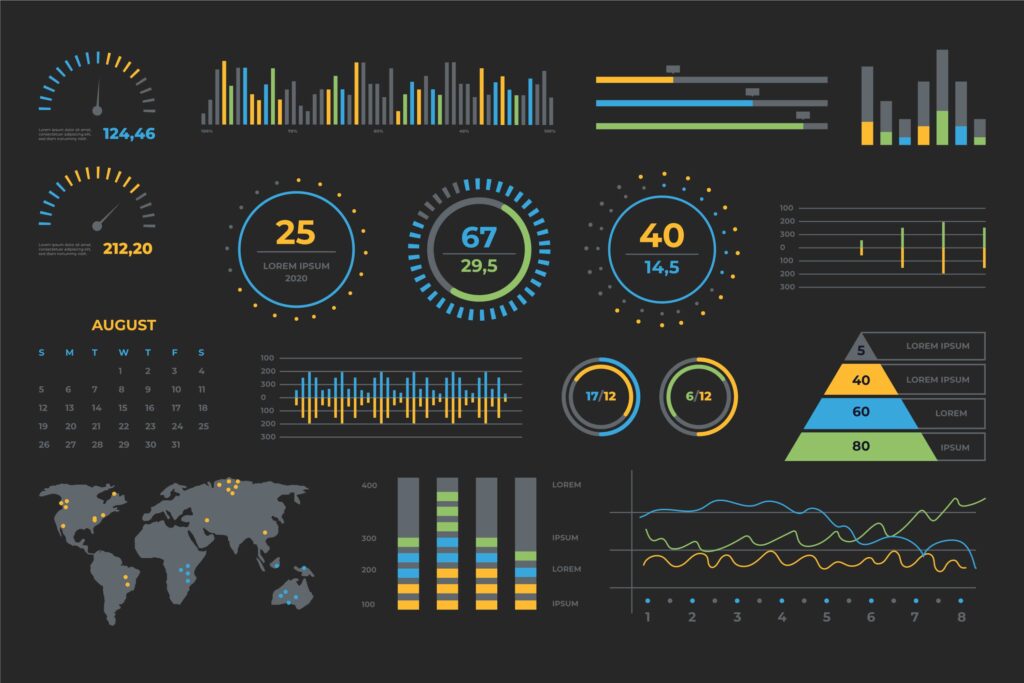
Different visuals serve different purposes. For instance, bar graphs are great for comparing data, while pie charts effectively show proportions. Select the visualisation that best communicates your data and aligns with your objectives.
Ensure Data Quality
The information derived from data visualisation is only as good as the data fed into the system. Ensure you use good quality, accurate, and updated data to avoid misinformed decisions.
Final Thoughts
Data visualisation is not just about beautiful charts and graphs. It’s a game-changer in the realm of decision-making. In a world dominated by data, data visualisation serves as a bridge, translating complex data into understandable and actionable information. It’s a powerful tool that accelerates decision-making, drives operational efficiency, and boosts business growth.
Embracing data visualisation can be the key to unlocking the full potential of your business decisions. As American statistician W. Edwards Deming once said, “Without data, you’re just another person with an opinion.” So, make your decisions count, use data, visualise it, and let it guide your path to success.

- All Courses
- IT & Software317
- Management263
- Teaching and Education229
- Business219
- Health and Fitness216
- Health & Safety155
- Engineering & Technology141
- Quality Licence Scheme136
- Health and Social Care128
- Healthcare123
- Accounting & Finance111
- Psychology96
- Lifestyle94
- Employability91
- Marketing75
- Office Productivity59
- Animal Care55
- Design and Photography48
- Beauty & Makeup43
- Design39
- Accounting & Bookkeeping32
- Web Development11
- Child Care8
- Construction7
- Agriculture5
- Environment1

Awarded By

0 responses on "Data Visualisation: Your Key to Better Decision Making"